

There is a correlation between C02 levels in the atmosphere and sea level rises. The world sea level has risen approximately 20cm since 1900. CO2 levels in the atmosphere equate historically to a higher sea level than we have in 2008. There is a time lag effect due to the time taken for glaciers and ice shelves to melt.
Temperature and sea level changes
So far we have looked at the astonishing melting of the ice in the Arctic, at what the IPCC did or didn’t do about sea level rise and at Hansen’s recent thinking on the matter. Now I’d like to give a few snapshots of what the real world implications would be.
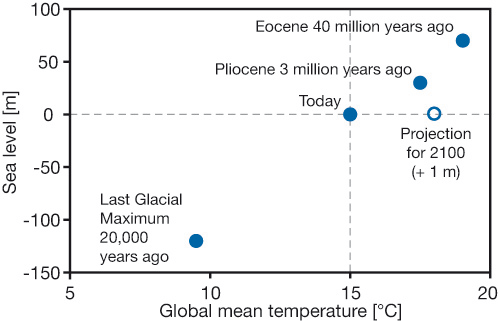
The story of temperature and sea level change is encapsulated in that really neat little image at the top of the post which I got from Climate Code Red (February 2008). They got it via Rahmstorf from Archer, 2006.
We can argue about the extremities. The last glacial maximum may have been 5 or 6C colder than now. Hansen puts an ice-free world at 5c warmer. It might turn out to be 6C if, perish the thought, Armageddon comes to be. But anyone can see there’s a problem. When 10-12C gives you close to 200 metres of sea level change each degree means a lot.
A further insight comes from an Emeritus Professor called William Ruddiman. His thesis is that humans have been altering the climate for the last 8000 years through land clearing and methane-producing rice growing. Hansen reckons that the effect he describes is real, but somewhat less than Ruddiman thinks. Yet it’s a fascinating article (pdf). For our purposes the important point is that Ruddiman finds that the threshold for a new ice age to start building is 245ppm of CO2 corresponding to a temperature about 2C less than the present.
So in that neat little graph you can’t just join up the dots of sea level in a more or less straight line. There needs to be a flat section between the temperature values of 13 and 15C. That represents the unusual stability given us as paradise on earth, or at least civilisation as we know it in the last 8000 years or so. A period when Co2 levels didn’t stray very far at all from 280ppm.
So coming out of the last ice age each degree in temperature change corresponded to about 30-40m of sea level change. Going forward we can look forward to from 12 to 18 metres for each degree of warming.
Remember the three graphs from the post about the IPCC that linked temperature, greenhouse gases and sea level, with ice sheets thrown in. (Original from NASA)

Temperature and GHGs are conjoined as it were. If one moves so does the other. When temperature moves so does sea level as a cansequence.
I can’t do tables so here’s five statements that link levels of CO2e and temperatures (referenced to pre-industrial) with sea level rise.
- 180ppm give a temperature of -5C and a sea level of -120m
- 280ppm give a temperature of 0C and a sea level of 0m
- 280-300ppm give a temperature of 1.7 to 2.7C and a sea level of 4-6m
- 380 (360-400)ppm give a temperature of 2.7 to 3.7C and a sea level of 15 to 35m
- 425 (350-500)ppm give a temperature of 5.7C and a sea level of 75m
The last three rely on the paleoclimate record going back increasingly into the past, so the uncertainty grows with each one. The last one, for example comes from Hansen. It wasn’t long ago that he was saying 500ppm plus or minus 150 for an ice-free world. Either way the lower bound is 350ppm and to be avoided if possible.
The sea levels would take time, but are implied in the nominated levels of CO2.
The implications of sea level rise are very serious.
In Climate Code Red (February 2008) the authors point out that long before Greenland or West Antarctica disintegrate, with 1-2m sea level rise the results would be catastrophic. The authors quote Stern (November 2006):
“currently, more than 200 million people live in coastal floodplains around the world, with two million square kilometres of land and one trillion dollars worth of assets less than one metre elevation above current sea level.”
In Climate Code Red they suggest that you can use a sea-rise level overlay such as http://flood.firetree.net/ with Google Earth to see where the water goes.
Many major cities are low lying and are very much in the front line of sea level change.
Some of these assets include American naval installations and indeed major centres. On cities Climate Code Red points out (assuming 20% loss of Greenland – I make that 1.4 metres):
Many of the world’s major cities (22 of the top 50) are at risk of flooding from coastal surges, including Tokyo, Shanghai, Hong Kong, Mumbai, Kolkata, Karachi, Buenos Aires, St Petersburg, New York, Miami and London. In almost every case, the city relies on costly flood defences for protection. Even if protected, these cities would lie below sea level with a residual risk of flooding like New Orleans today.
And:The 2006 Conference of the International Association of Hydrogeologists heard that rising sea levels will also lead to the inundation by salt water of the aquifers used by cities such as Shanghai, Manila, Jakarta, Bangkok, Kolkata, Mumbai, Karachi, Lagos, Buenos Aires and Lima. “The water supplies of dozens of major cities around the world are at risk from a previously ignored aspect of global warming. Within the next few decades rising sea levels will pollute underground water reserves with salt…
CO2 levels in the atmosphere are now 387ppm
World C02 levels are now at a record high of 387 parts per million (ppm), up almost 40% since the industrial revolution and the highest for at least the last 650,000 years.[1] This could translate to eventual sea level rises in the range of 15 to 35m, which would be catastrophic. So we need to reduce C02 emissions now.
The present-day global temperature is already seeing significant global ice melt – which together with thermal expansion is driving sea level rise. If present-day or higher global temperatures persist there does not appear to be any plausible reason why the present ice melt will pause, diminish or stop. Instead the ice melt will continue at rates that are commensurate with prevailing temperatures on the significant ice masses and ice sheet dynamics until the ice is gone.
A pragmatic view suggests that unless GHG concentrations fall to the point where temperatures reduce to pre-industrial levels (at which ice sheets were comparatively stable) then it appears inevitable that the ice melt will continue until most if not all surface ice is melted. Thus – even if temperatures only remain at present-day levels (i.e. if the current warming ‘in the pipeline’ represented by the present levels of GHGs is not realised) – there will be an unstoppable progression of melt until sea levels eventually stablise at between 70 metres to 80 metres above present day levels.
As several commentators have noted the dynamics of ice sheet disintegration are not well understood, and so the time frame for the full range of sea level rise is uncertain, but with “business as usual” the eventual outcome appears to be both inevitable and unavoidable.
Sea level rise by country

- About 2.6 percent of the world’s population — about 177 million people — live in areas that will be vulnerable to chronic flooding within the next 100 years. At minimum, even with extremely rigorous cuts to global emissions and with oceans much less sensitive to climate change than expected, 1.9 percent of the population of coastal countries would be affected. At worst, the figure would be 3.1 percent.
- The Netherlands would be the most exposed, with more than 40 percent of its country at risk, but it also has the world’s most advanced levee system, which means in practice its risk is much lower.
- Flood-exposure estimates, including those shown above, may still understate the risks. Using more detailed elevation data for the United States than is available globally, for instance, the group found that estimated flood exposure was probably much too conservative. Applied globally, that means more than 500 million people could be living in places that are at risk of regular flooding in the next century.
- More than a quarter of Vietnam’s residents live in areas likely to be subject to regular floods by the end of the century.
- Four percent of China’s residents — 50 million people — live in the same kind of areas.
- Across the globe, about one person in 40 lives in a place likely to be exposed to such flooding by the end of the century
- Globally, eight of the 10 large countries most at risk are in Asia.[2]
Article source
- Author: Brian
- Link: Sea level rise: some real world implications, Larvatus Prodeo
See also
External links
- Wikipedia:Current sea level rise
- Flooding Risk From Climate Change, Country by Country, New York Times
References
- World CO2 levels at record high, scientists warn, May 12, 2008
- Flooding Risk From Climate Change, Country by Country, NYTimes.com
![]()